Health Inequalities
Introduction
This report highlights the work undertaken by Cumbria, Northumberland, Tyne and Wear NHS Foundation Trust during the past year to make the NHS a better and fairer place for patients and staff. The report covers the period from April 2023 to the end of March 2024. It also details our Equality Objectives which were agreed during the year to meet our requirements under the Equality Act of 2010.
It is named ‘Equality, Diversity and Human Rights’ report because it shows the work we have done to:
- Help all people, whoever they are, to receive high quality health care – we call this equality.
- Recognise and celebrate the fact that every person is an individual – we call this diversity.
- Make sure every person is treated with dignity and respect – we call this human rights.
Key highlights for the Equality Diversity and Inclusion Team this year have been working closely with our locality groups and staff networks particularly around cultural awareness and we hope that we can continue this work with the new Care Groups during 2024-2025. The coming year for EDI in the Trust will see an important focus on health inequalities and we will be working with the communities which we serve to best meet those needs.
We hope you enjoy reading about our achievements in the past year, and we look forward to telling you about our busy year ahead.
Staff Networks
The Trust has three Staff Networks: Cultural Diversity Staff Network, Disabled Staff Network, and LGBTQ+ Staff Network. Each network has two co-chairs who meet regularly with the Equality, Diversity & Inclusion Team to talk about cross-cutting issues as well attend Trust Leadership Forums. Each staff network is allocated an annual budget for initiatives that will support key work to address Trust-wide actions, as well as weekly protected release time for each co-chair to undertake network duties.
As well as Staff Networks, there are a number of support groups that all staff are welcome to attend. These include:
- CNTW Armed Forces and Veterans Association
- The Mind, Health & Wellbeing Community
- Staff Carer Support Group
- Menopause cafés
- AUsome cafés
- Prayer cafés
The Cultural Diversity Staff Network actively engages and contributes ensuring equality, acceptance and inclusion within the Trust.
Black History Month Event
The theme for 2023 was saluting our sisters”, focusing on the contributions of black women to our country. This hybrid event took place on 6th October 2023 and was open to all staff and volunteers. The following prestigious guests attended:
- Reni Eddo-Lodge, award-winning journalist and author of #1 Sunday Times bestseller ‘Why I’m No Longer Talking to White People About Race’. (Her book was available to staff via CNTW library services, and the Library hosted lunchtime book clubs for staff to discuss the book.)
- Paul Attwal, founder of the See ME First initiative, which was launched across CNTW as part of the event.
- Paul Deemer, Head of Diversity and Inclusion at NHS Employers.
The network also hosted a special guest speaker event with Dr Lade Smith CBE, President of the Royal College of Psychiatrists (RCPsych), on 20th October 2023.
See Me First Initiative
Aligning with Black History Month, the Cultural Diversity Staff Network in conjunction with the Trust, launched the See Me First Initiative which encourages pledges for active allyship. The executive board made a statement of support for the initiative that said “The Trust is an open, non-judgemental, and inclusive organisation that will not tolerate racism or discrimination. We celebrate the diversity of our staff and community. We will treat all our staff equitably, with dignity and respect, whatever their race, gender, religion, age, disability or sexual orientation.”
Since the launch, 252 staff have taken their pledge to actively take responsibility for their allyship. The pledge form asks staff to write what has motivated them to take the pledge, here are just a few of the quotes from those who have pledged:
- "I want discrimination to stop in the workplace and everyone to be treated as one, irrespective of their skin colour.”
- "I work with a lot of agency staff, I want to be a champion against racism and discrimination.”
- "To be inclusive in all walks of life.”
- "I believe that people should be treated fairly, not by their skin, gender or identities but rather they should be acknowledged for their accolades. See me for the skills I have to do my job.”
Committed to creating a fair and diverse workplace. The staff network actively engages and contributes towards ensuring equality, acceptance and inclusion within the Trust.
Disability History Month
As part of Disability History Month in 2023, the Disabled Staff Network arranged a series of ongoing ‘lunch and learn’ sessions across many months. These sessions are available to all staff and have been extremely well attended, they included:
- Keiran Rose: The Autistic Advocate.
- Martin Pistorius: How my mind came back to life, and no one knew.
- Yasmin Sheikh: Disability Rights UK & Reasonable Adjustments.
- Elaine McGreevy: Ableism is Everyone’s Business.
- British Dyslexia Association: Dyslexia Training.
- Kerry Pace: Chronic Conditions, Pain and Fatigue in the Workplace.
The aim of the LGBTQ+ Staff Network is to promote a working environment where all LGBTQ+ staff feel supported, valued, and to challenge discrimination.
LGBTQ+ History Month Conference
The theme for LGBT+ History Month 2024 celebrated LGBT+ peoples’ contribution to the field of medicine and healthcare, both historically and today. The LGBT+ Staff Network hosted four lunchtime sessions for staff throughout February 2024, these focused on:
- Stories from our own staff and their time in the NHS
- Gender: the past, the present, and the future
- LGBT+ over the years: a discussion around LGBT+ in older person services
- Neurodiversity and LGBT+
In February 2023, CNTW’s Equality, Diversity and Inclusion (EDI) Team were approached by a Nursing Assistant on Rose Lodge (specialist learning disability treatment and assessment unit), who was interested in getting involved with EDI work ongoing in the Trust. Conversations started to focus specifically on the need to explore piloting Cultural Celebration events within the Trust, with the aim to celebrate the Trust’s increasingly diverse workforce and to offer opportunities to learn about and share cultural cuisine, attire, music, and much more.
Following multiple discussions, the Trust agreed that the first Cultural Celebration Event should take place after Ramadan, Easter and Pesach, and to take place on a weekend or Bank Holiday in the hopes that more staff would be able to participate. Further input was gathered from ward managers, a Consultant Liaison Psychiatrist (with particular knowledge in cultural competency, refugees and asylum seekers), and Co-Chair of the Cultural Diversity Staff Network.
CNTW’s first Cultural Celebration Event took place on 22 April 2023, it was such a success that a further 5 events took place across different wards within the Trust.
The six events that took place between April and November 2023 included food originating from many different countries, staff world maps, cultural decorations, country flags, and music with playlists of diverse music compiled by staff. Some of the events had raffles that raised money for CNTW’s in-house charity ‘The Shine Fund’, and attendees of the events were encouraged to add their country flag to the world maps. The world maps started lovely visuals of the diverse workforce of CNTW and many conversations were sparked around cultural attire, food provided, and everyone who participated were completely open and willing to try new cuisines. More fun activities included cultural pop quizzes, and even Indian dance lessons.
Due to the success of these events, CNTW’s EDI Officer wrote a ‘create your own cultural celebration day’ toolkit and published it on the staff intranet for staff to access as and when required.
The toolkit covers necessary guidance for teams to get creative and host their own event, it follows 5 simple steps to get started which includes recommendations for teams such as risk assessments, involving patients, promoting the events, preparing for the day, and extra suggestions for consideration.
The overall aim is to grow and mould these events to become an annual occurrence for teams and wards, and an opportunity for staff and/or patients to initiate those important conversation around culture, identity, and overall knowledge and competence that reflects the population CNTW serves.
Each of the events that took place across the Trust incorporated anonymous comment boxes for feedback and suggestions for future events.
Comments received via anonymous comment boxes reflected the following key points:
- “Brilliant event, absolutely enjoyed it. Hoping for more such events for a positive break from hectic routine”
- “Absolutely amazing experience and a definite eye opener. Such a brilliant way to learn more about your colleagues”
- “Today has been a great day, we all enjoyed ourselves and seeing everyone together is lovely. Hope we will do this again”
- “I had a great time and looking forward to more of such events on the ward”
- “What a fabulous event, lots of food and different cultures. Amazing!”
- “What an amazing event. Everyone looked stunning and really enjoyed their dancing and food. Well done”
- “Really lovely day – enjoyed learning about everyone’s traditions and generally spending time with the team out with a working day.”
The Trust was awarded £10,000 funding at the start of 2023 by NHS England to develop a set of resources for disabled staff and their managers. The Equality Diversity and Inclusion Team worked during 2023-24 with our Disabled Staff Network, colleagues from Workforce and Organisational Development and Informatics in conjunction with local disability-led charity, Difference, to develop interactive intranet-based toolkits – one specifically for disabled staff, the other their managers. The project has been an excellent example of coproduction and as we publish this report the toolkits have been finalised and built on the intranet in advance of an official launch in May 2024.
Content across the staff and manager toolkits includes:
- Process for Requesting Reasonable Adjustments
- Completing the Disabled Staff Passport
- What is disability … Am I disabled?
- Hidden & Obvious Impairments
- Disability Identity & Language
- Definitions of Disability
- What is Neurodiversity?
- Reasonable Adjustments
- Why We Must Increase Accessibility At Work
- Talking About Disability, Wellbeing & Reasonable Adjustments
- Things to Consider When Talking About Disability With Staff
- Making Training More Accessible
- Changing Someone's Working Arrangements
- Finding a Different Way to Do Something
- Providing Equipment, Services or Support
- Reasonable Adjustment for Absence
- Disability-Related Leave
- Disability Identity & Language
- A-Z of Workplace Adjustments
- Frequently asked questions
On of our Forensic Child and Adolescent Psychiatrists at CNTW and Chair of Iranian Diaspora Association of Psychiatrists arranged a series of free parenting programmes for the Farsi community. He collaborated with a wide range of subject experts and delivered 10 sessions to support Iranian families and their children across January to March 2024. This fantastic programme was aligned to CNTW's strategic ambition to reach out to those who need mental health support in the communities we serve.
Each session covered different topics to help identify, address, and support various aspects of a child’s life. Topics included how to support children who are struggling with anxiety, depression, bullying, psychological trauma, ADHD, Autism, self-harming, substance abuse, violent and aggressive behaviour, and parenting approaches to help build a better future for children. Each session included specialist guest speakers, role-playing scenarios guided by multi- professional teams, and allowed families the opportunity to have any questions answered. The programme was delivered both in person at Walkergate Park Hospital and online via a virtual link, allowing increased accessibility for the community.
The 10th and final session took place on 21 March 2024, which combined a celebration of Nowruz (Persian New Year) and career conversations for children.
The International Recruitment Team, alongside the Equality, Diversity & Inclusion Team, workforce representatives, and Cultural Diversity Network have introduced a Culture Lab. This came out of the Accelerated Development Project in partnership with North Cumbria Integrated Care (NCIC), who have already implemented a Culture Lab within their Trust. The Culture Lab is created by staff, for staff – it represents the wonderful diversity of our staff and encourages conversation starters between colleagues. The Culture Lab provides lived-experience information on the countries our staff come from, allowing a more personal touch when learning about different cultures.
All staff are actively encouraged to contribute to the Culture Lab, and it will be regularly updated to represent our increasingly diverse workforce. Below is an example of the information that has been submitted by staff so far (20 and counting!)
Workforce Race Equality Standard
The most recent CNTW WRES and WDES Annual Report (22/23) was published in August 2023. The data compiled within this report is from a snapshot taken on 31 March 2023, as well as findings from the most recent NHS Staff Survey which took place in Autumn 2022.
CNTW WRES 2023 Key Findings
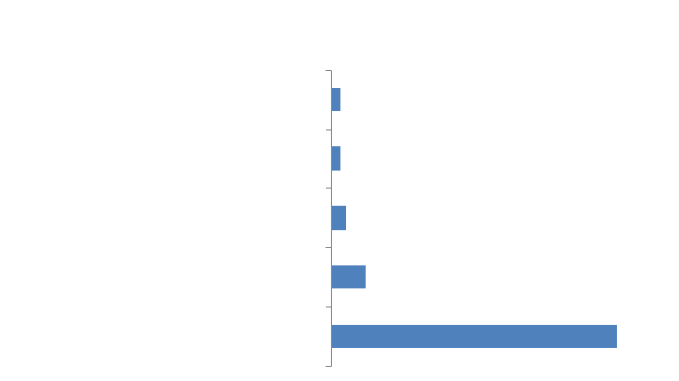
- Black & Minority Ethnic (BME) staff made up 9.06% of the total CNTW workforce.
- 3.2% of staff in non-clinical roles were from BME background and 82.5% were employed at band 5 or below, 77% of White non-clinical staff were employed at band 5 or below.
- 8.6% of staff in clinical (non-medical) roles were from BME background and 73.5% were employed at band 5 or below, 47.6% of White clinical staff were employed at band 5 or below.
- 50.2% of medical staff were from BME background with 43.1% employed at Consultant Grade and 56.8% of White doctors employed at Consultant Grade.
- White job applicants are 2.12 times more likely to be appointed from shortlisting compared to BME applicants (down from 2.5 in 2022).
- BME members of staff are 1.57 times more likely to be in a formal disciplinary process compared to White staff (down from 2.69 in 2022).
CNTW WRES 2023 Recommendations
- Continue Trust-wide rollout of Respectful Resolution Framework
- Implement ongoing support package for Cultural Ambassadors in partnership with Capsticks to continue overall improvement for staff entering formal disciplinary processes.
- Trust Board to review relevant data, identify EDI areas of concern, and prioritise EDI actions in annual appraisals.
- Develop a Race Pay Gap Report to identify actions and eliminate race pay gaps.
- Develop centralised Cultural Competency and Awareness training package to create inclusive team cultures and ensure psychological safety.
- Launch awareness/ allyship initiatives.
Workforce Disability Equality Standard
The most recent CNTW WRES and WDES Annual Report (22/23) was published in August 2022. The data compiled within this report is from a snapshot taken on 31 March 2023, as well as findings from the most recent NHS Staff Survey which took place in Autumn 2022.
CNTW WDES 2023 Key Findings
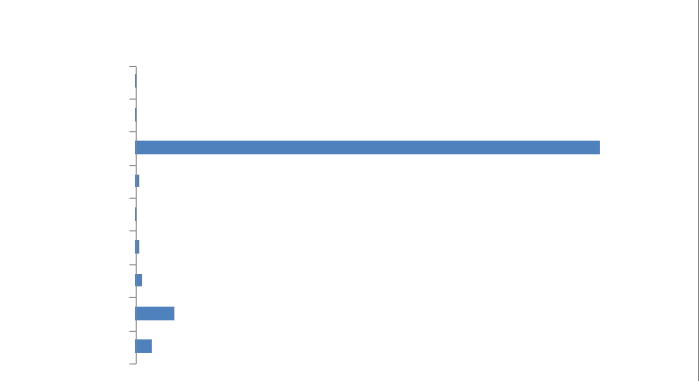
- Disabled staff made up 8.2% of the total CNTW workforce from ESR data, despite 33.5% of staff stating they live with a long-term condition in the NHS Staff Survey.
- The recruitment of non-disabled staff to disabled staff when expressed as a ratio is 0.54:1. Disabled applicants are more likely to be appointed compared to non-disabled shortlisted candidates (the ratio was 0.91:1 in 2022).
- All figures for bullying and harassment by patients, public, colleagues, or managers experienced by disabled staff demonstrate an improvement over the last 2 reporting periods.
- There are more disabled staff employed at band 5 or below in both clinical and non-clinical roles. There are more non- disabled medical staff at consultant grade than disabled staff.
- 81.9% disabled staff said adequate adjustments to carry out their work were made by the Trust (an improvement over the last 2 reporting periods).
- There was a 5.1 percentage point decrease in disabled staff believing the organisation provides equal opportunities for career progression, compared to the last reporting period.
CNTW WDES 2023 Recommendations
- Develop Managers’ Toolkit for staff with disabilities and reasonable adjustments (WDES Innovation Fund).
- Specialist training for HR Staff (WDES Innovation Fund).
- Trust Board to review relevant data, identify EDI areas of concern, and prioritise EDI actions in annual appraisals.
- Review flexible working policy.
- Develop and implement an improvement plan to address health inequalities within the workforce.
- Work with Capsticks to improve availability of data for capability measures.
National WRES Benchmark
The data is taken from the NHS Workforce Race Equality Standard 2023 Analysis Report, which gives a national picture across all NHS Trusts. The data is compiled from a snapshot of 31 March 2023 and responses from the NHS Staff Survey 2022.
NHS England WRES 2023 Key Findings
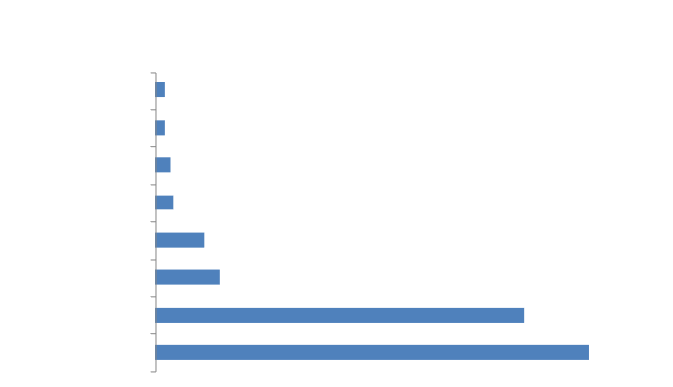
- 26.4% of the workforce across NHS Trusts are BME (an increase of 13% from last year).
- The North East and Yorkshire region has a 15.8% BME workforce.
- Across all staff groups, the highest proportion of BME staff (38.5%) are employed at band 5, with the lowest proportion of BME staff (11.2%) employed at band 9 or VSM. However, 6% of staff at VSM level did not disclose their ethnicity.
- Across non-clinical staff groups, the largest proportion of BME staff (19.8%) are employed at band 6, with the lowest proportion of BME staff (10.7%) employed at VSM.
- Across clinical staff groups, the largest proportion of BME staff (41.6%) are employed at band 5, with the lowest proportion of BME staff (11.7%) were employed at band 8D (13.3% VSM).
- Across medical staff groups, the BME representation is 46.8%. Of 129,143 medical staff, 40.5% BME staff were employed at Consultant grade, with 53.3% white staff employed at Consultant grade.
- Nationally, white staff are 1.59 times more likely to be appointed from shortlisting compared to BME applicants.
- Nationally, BME staff are 1.03 times more likely to enter formal disciplinary processes compared to white staff.
- According to the NHS Staff Survey 2022 results, more BME staff (30.4%) than white staff (26.8%) experienced bullying, harassment or abuse from patients, relatives or the public in the last 12 months.
- According to the NHS Staff Survey 2022 results, 16.6% BME staff experienced discrimination from other staff in the last 12 months, compared to 6.7% white staff.
- 10.8% executive directors recorded their ethnicity as BME, an increase from 9.7% in 2022 and 8.9% in 2021.
- 20.3% non-executive directors recorded their ethnicity as BME, an increase from 18.4% in 2022 and 16% in 2021.
National WDES Benchmark
The data is taken from the NHS Workforce Disability Equality Standard 2023 Analysis Report, which gives a national picture across all NHS Trusts. The data is compiled from a snapshot as of 31 March 2023 and responses from the NHS Staff Survey 2022.
NHS England WDES 2023 Key Findings
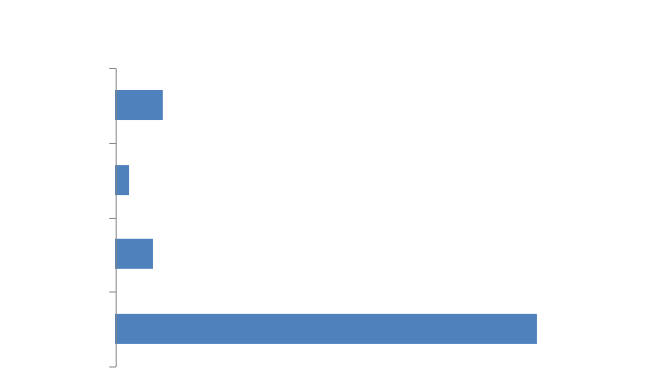
- Across all NHS Trusts, only 4.9% of staff reported having a disability on ESR (Electronic Staff Record), however 23.4% staff reported having a long-term illness or condition in the NHS Staff Survey 2022.
- Across all NHS Trusts, the disability status of 16.6% staff is ‘unknown’. This encompasses a declaration of ‘prefer not to answer’, ‘not declared’, or ‘unspecified’.
- In the North East & Yorkshire region, the declaration rate was slightly higher (5.1% on ESR and 26.1% on NHS Staff Survey 2022).
- According to the NHS Staff Survey 2022, more disabled staff than non-disabled staff reported experiencing harassment, bullying or abuse from patients and the public (7.2% disparity), managers (6.9% disparity), and other staff (8.3% disparity).
- The relative likelihood of disabled staff being appointed from shortlisting is 0.99, which means disabled staff were slightly more favoured over non-disabled staff (1.0 represents equity).
- In 2023, the disability declaration rate for band 8C and above was 3.9%, and 5.2% for bands below 8C. 5.7% board members declared a disability.
- Disabled staff were 2.17 times more likely to enter a formal capability process on the grounds of performance, compared to non-disabled staff.
- According to the NHS Staff Survey 2022, 52.1% disabled staff and 57.7% non-disabled staff believe their organisation provides equal career progression or promotion, slightly higher than the previous reporting period.
- 27.7% disabled staff said they felt pressure from their manager to come to work, despite not feeling well enough (compared to 19.9% non-disabled staff). This is a marginal improvement from the last reporting period.
- 73.4% disabled staff said their employer made workplace reasonable adjustments to enable them to carry out their work.
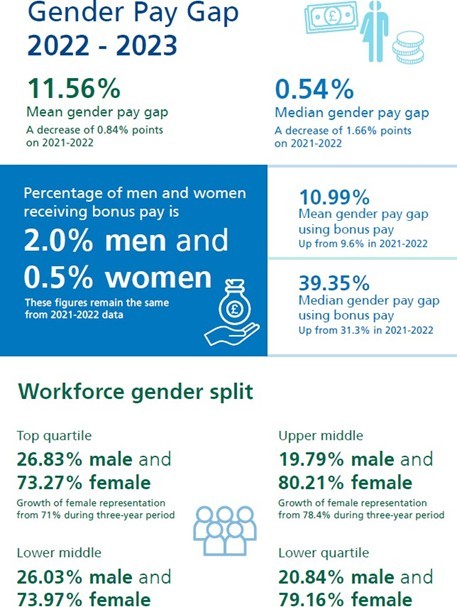
Gender Pay Gap
Equality, Diversity and Inclusion Objectives 2024 -2025
In November 2023, we set three key objectives for the coming year. These are:
- A programme of actions to address progression within the Trust for staff protected under the Equality Act 2010. We know from analysis of our Workforce Race and Disability Equality Standards that the distribution of staff from these protected characteristics is skewed towards Agenda for Change Bands 5 and below.
- Actions to eliminate the conditions in which bullying, discrimination, harassment and physical violence at work occur. Our staff survey results regularly show a gap between the experiences of staff that have a protected characteristic and those who do not. The challenge is therefore to eliminate the gap between the experiences of staff, whilst bringing down the overall levels of bullying, discrimination, harassment and physical violence. We will utilise techniques highlighted as best practice in the EDI Improvement Plan Repository on NHS Futures and build upon existing work taking place within the Trust – particularly to extend pilot work on Hate Crime, Safe Spaces and Cultural Allyship Trust-wide.
- A baseline assessment to establish how we will engage with racialised and ethnic minority communities to identify and agree core organisational competencies requiring further development, then agree measurable and practical actions to develop them in local plans.
These objectives and actions have been determined by a mapping exercise of our existing position to two national initiatives that have been launch in the last year, the NHS Equality, Diversity and Inclusion Improvement Plan and the Patient Carer Race Equality Framework.
The NHS Equality, Diversity and Inclusion (EDI) Improvement Plan was launched in June 2023 by NHS England. It sets out targeted actions to address the prejudice and discrimination, direct and indirect, that exists through behaviour, policies, practices and cultures against certain groups and individuals across the NHS workforce. It is based on the premise that equality, diversity and inclusion is a key foundation for creating a caring, efficient, productive and safe NHS. It details 6 High Impact Actions required to make the changes that NHS staff and patients expect and deserve and who is accountable and responsible for their delivery. It outlines how NHS England will support implementation and a framework for integrated care boards to produce their own local plans.
The Patient Carer Race Equality Framework (PCREF) was one of the key recommendations of the Independent Review of the Mental Health Act (MHA). The MHA African and Caribbean group was established to support with the aims of the Independent Review, focusing on the inequalities faced by racialised and ethnically and culturally diverse communities. At its core, the PCREF aims to support NHS Mental Health Trusts to:
- Improve their interaction with racialised and ethnically and culturally diverse communities
- Raise awareness of organisations’ own cultural and racial bias and provide a framework to reduce them
- Improve governance, accountability, and leadership on improving experiences of care for racialised and ethnically and culturally diverse communities.
We look forward to being able to report progress on these important pieces of work in our next annual report.
Appendix 1 - WRES and WDES Data Collection 2023
Percentage of staff in each of the AfC Bands 1-9 or Medical and Dental subgroups and VSM (including executive Board members) compared with the percentage of staff in the overall workforce.
| White | BME | Ethnicity Unknown/ NULL | |
|---|---|---|---|
| 1a) Non-clinical workforce | Verified figures | Verified figures | Verified figures |
| Under Band1 | 11 | 1 | 0 |
| Band 1 | 1 | 0 | 0 |
| Band 2 | 231 | 5 | 2 |
| Band 3 | 482 | 21 | 6 |
| Band 4 | 332 | 9 | 2 |
| Band 5 | 186 | 7 | 1 |
| Band 6 | 136 | 4 | 3 |
| Band 7 | 75 | 4 |
1 |
| Band 8A | 52 | 0 | 0 |
| Band 8B | 34 | 1 | 0 |
| Band 8C | 2 | 0 | 0 |
| Band 8D | 1 | 0 | 0 |
| Band 9 | 1 | 0 | 0 |
| VSM | 4 | 0 | 0 |
Percentage of staff in each of the AfC bands 1-9 or Medical and Dental subgroups and VSM (including executive Board members) compared with the percentage of staff in the overall workforce.
| White | BME | Ethnicity unknown/ NULL | |
| Clinical workforce | Verified figures | Verified figures | Verified figures |
| Under Band 1 | 0 | 0 | 0 |
| Band 1 | 1 | 0 | 0 |
| Band 2 | 10 | 1 | 1 |
| Band 3 | 1596 | 243 | 10 |
| Band 4 | 369 | 24 | 3 |
| Band 5 | 590 | 106 | 7 |
| Band 6 | 1449 | 71 | 23 |
| Band 7 | 895 | 39 | 7 |
| Band 8A | 269 | 14 | 4 |
| Band 8B | 110 | 7 | 1 |
| Band 8C | 77 | 3 | 1 |
| Band 8D | 19 | 1 | 0 |
| Band 9 | 1 | 0 | 0 |
| VSM | 1 | 0 | 0 |
| Consultants | 116 | 88 | 0 |
| of which senior medical manager | 0 | 1 | 0 |
| Non-consultant career grade | 27 | 52 | 0 |
| Trainee grades | 9 | 12 |
0 |
| Other | 0 | 0 | 0 |
Relative likelihood of staff being appointed from shortlisting across all posts
| White | BME | Ethnicity unknown/ NULL | |
| Verified figures | Verified figures | Verified figures | |
| Number of shortlisted applicants | 4128 | 1339 | 0 |
| Number appointed from shortlisting | 1405 | 215 | 0 |
| Relative likelihood of appointment from shortlisting | 34.04% | 16.06% | 0% |
| Relative likelihood of White staff being appointed from shortlisting compared to BME staff | 2.12 |
Relative likelihood of staff entering the formal disciplinary process, as measured by entry into a formal disciplinary investigation
| White | BME | Ethnicity unknown/ null | |
| Number of staff in workforce | 7087 | 713 | 71 |
| Number of staff entering the formal disciplinary process | 76 | 12 | 0 |
| Likelihood of staff entering the formal disciplinary process | 1.07% | 1.68% | 0.00% |
| Relative likelihood of BME staff entering the formal disciplinary process compared to White staff | 1.57 |
Relative likelihood of staff accessing non-mandatory training and CPD
| White | BME | Ethnicity unknown/ Null | |
| Number of staff in workforce | 7087 | 713 | 71 |
|
Number of staff accessing non-mandatory training and CPD |
No figures provided for 2023 | ||
|
Likelihood of staff accessing non-mandatory training and CPD |
|||
| Relative likelihood of White staff accessing non-mandatory training and CPD compared to BME staff |
Percentage of staff experiencing harassment, bullying or abuse from patients/ service users, relatives or the public in the last 12 months
| White | All other ethnic groups | |
| Percentage of staff experiencing harassment, bullying or abuse from patients/ service users, relatives or public in the last 12 months | 26.6% | 36.2% |
| Total responses | 3269 | 229 |
Percentage of staff experiencing harassment, bullying or abuse from staff in the last 12 months
| White | All other ethnic groups | |
| Percentage of staff experiencing harassment, bullying or abuse from staff in the last 12 months | 13.6% | 24.1% |
| Total responses | 3262 | 228 |
Percentage of staff believing that the organisation provides equal opportunities for career progression or promotion
| White | All other ethnic groups | |
| Percentage of staff believing that the organisation provides equal opportunities for career progression or promotion | 68.2% | 50.2% |
| Total responses | 3239 | 225 |
Percentage of staff experiencing discrimination at work from manager/ team leader or other colleagues in the last 12 months
| White | All other ethnic groups | |
| Percentage of staff experiencing discrimination at work from manager/ team leader or other colleagues in the last 12 months | 4.8% | 17.3% |
| Total responses | 3260 | 225 |
Percentage difference between the organisation's Board voting membership and its overall workforce
| White | BME | Unknown | |
| Total Board Members | 13 | 1 | 0 |
| Voting Board Members | 13 | 1 | 0 |
| Exec | 5 | 1 | 0 |
| NED | 8 | 0 | 0 |
Trust Board BME 7.7%
Trust Workforce BME 9.06%
Percentage of staff in each of the AfC Bands 1-9 or Medical and Dental subgroups and VSM (including executive Board members) compared with the percentage of staff in the overall workforce
| Disabled | % Disabled | Non-disabled | % Non-disabled | Unknown/ null | % Unknown/ null | Total | |
| 1a) non-clinical staff | |||||||
| Under Band 1 | 2 | 16.7% | 9 | 75% | 1 | 8.3% | 12 |
| Bands 1 | 0 | 0% | 1 | 100% | 0 | 0% | 1 |
| Bands 2 | 23 | 9.7% | 198 | 83.2% | 17 | 7.1% | 238 |
| Bands 3 | 44 | 8.6% | 414 | 81.3% | 51 | 10% | 509 |
| Bands 4 | 36 | 10.5% | 288 | 84% | 19 | 5.5% | 343 |
| Bands 5 | 20 | 10.3% | 157 | 80.9% | 17 | 8.8% | 194 |
| Bands 6 | 8 | 5.6% | 118 | 82.5% | 17 | 11.9% | 143 |
| Bands 7 | 3 | 3.8% | 71 | 88.8% | 6 | 7.5% | 80 |
| Bands 8a | 6 | 11.5% | 42 | 80.8% | 4 | 7.7% | 52 |
| Bands 8b | 0 | 0% | 30 | 85.7% | 5 | 14.3% | 35 |
| Bands 8c | 0 | 0% | 2 | 100% | 0 | 0% | 2 |
| Bands 8d | 0 | 0% | 1 | 100% | 0 | 0% | 1 |
| Bands 9 | 0 | 0% | 1 | 100% | 0 | 0% | 1 |
| VSM | 4 | 100% | 0 | 0% | 0 | 0% | 4 |
| Other (e.g. Bank or Agency) Please specify in notes | |||||||
| Cluster 1: AfC Bands <1 to 4 | 105 | 9.5% | 910 | 82.5% | 88 | 8% | 1103 |
| Cluster 2: AfC Bands 5 to 7 | 31 | 7.4% | 346 | 83% | 40 | 9.6% | 417 |
| Cluster 3: AfC bands 8a and 8b | 6 | 6.9% | 72 | 82.8% | 9 | 10.3% | 87 |
| Cluster 4: AfC bands 8c to VSM | 4 | 50% | 4 | 50% | 0 | 0% | 8 |
| Total non-clinical | 146 | 1332 | 137 | 1615 |
Percentage of staff in each of the AfC Bands 1-9 or Medical and Dental subgroups and VSM (inlcuding executive Board members) compared with the percentage of staff in the overall workforce
| Disabled | % Disabled | Non-disabled | % Non-disabled | Unknown/ null | % Unknown/ null | Total | |
| 1b) Clinical staff | |||||||
| Under Band 1 | 0 | 0% | 0 | 0% | 0 | 0% | 0 |
| Bands 1 | 1 | 100% | 0 | 0% | 0 | 0% | 1 |
| Bands 2 | 6 | 54.55% | 5 | 45.45% | 0 | 0% | 11 |
| Bands 3 | 136 | 7.36% | 1435 | 77.61% | 278 | 15.04% | 1849 |
| Bands 4 | 40 | 10.10% | 326 | 82.32% | 30 | 7.58% | 396 |
| Bands 5 | 63 | 8.96% | 536 | 76.24% | 104 | 14.79% | 703 |
| Bands 6 | 143 | 9.27% | 1239 | 80.30% | 161 | 10.43% | 1543 |
| Bands 7 | 69 | 7.33% | 792 | 84.17% | 80 | 8.50% | 941 |
| Bands 8a | 20 | 6.97% | 248 | 86.41% | 19 | 6.62% | 287 |
| Bands 8b | 1 | 0.85% | 113 | 95.97% | 4 | 3.39% | 118 |
| Bands 8c | 1 | 1.23% | 69 | 85.19% | 11 | 13.58% | 81 |
| Bands 8d | 3 | 15% | 17 | 85% | 0 | 0% | 20 |
| Bands 9 | 0 | 0% | 1 | 100% | 0 | 0% | 1 |
| VSM | 0 | 0% | 1 | 100% | 0 | 0% | 1 |
| Other (e.g. Bank or Agency) Please specify in notes | 0 | 0 | 0 | 0 | |||
| Cluster 1: AfC Bands <1 to 4 | 183 | 8.1% | 1766 | 78.2% | 308 | 13.6% | 2257 |
| Cluster 2: AfC Bands 5 to 7 | 275 | 8.6% | 2567 | 80.5% | 345 | 10.8% | 3187 |
| Cluster 3: AfC Bands 8a and 8b | 21 | 5.2% | 361 | 89.1% | 23 | 5.7% | 405 |
| Cluster 4: AfC Bands 8c to VSM | 4 | 3.9% | 88 | 85.4% | 11 | 10.7% | 103 |
| Total clinical | 483 | 8.1% | 4782 | 80.3% | 687 | 11.5% | 5952 |
| Medical and dental staff, consultants | 11 | 5.42% | 143 | 70.44% | 49 | 24.14% | 203 |
| Medical and dental staff, non-consultants career grade | 7 | 8.86% | 58 | 73.42% | 14 | 17.72% | 79 |
| Medical and dental staff, trainee grades | 1 | 4.35% | 19 | 82.61% | 3 | 13.04% | 23 |
| Total medical and dental | 19 | 6.23% | 220 | 72.13% | 66 | 21.64% | 305 |
| Number of staff in workforce | 502 | 5002 | 753 | 6257 |
Relative likelihood of non-Disabled staff compared to Disabled staff being appointed from shortlisting across all posts
| Disabled | Non-disabled | |
| Number of shortlisted applicants | 647 | 14022 |
| Number appointed from shortlisting | 58 | 680 |
| Likelihood of shortlisting/ appointed | 0.089 | 0.048 |
| Relative likelihood of non-disabled staff being appointed from shortlisting compared to Disabled staff | 0.54 |
Relative likelihood of Disabled staff compared to non-disabled staff entering the formal capability process, as measured by entry into the formal capability procedure
| Disabled | Non-disabled | |
| Total number of staff | No figures provided for 2023 | |
| Average number of staff entering the formal capability process over the last 2 years (i.e. total divided by 2) | ||
| Likelihood of staff entering the formal capability process | ||
| Relative likelihood of Disabled staff entering the formal capability process compared to non-disabled staff |
Percentage of staff experiencing harassment, bullying or abuse from patients/ service users, relatives or the public in the last 12 months
| Disabled | Non-disabled | |
| Percentage of staff experiencing harassment, bullying or abuse from patients/ service users, relatives or the public in the last 12 months | 30.5% | 25.7% |
| Total number of responses | 1172 | 2335 |
Percentage of staff experiencing harassment, bullying or abuse from managers in the last 12 months
| Disabled | Non-disabled | |
| Percentage of staff experiencing harassment, bullying or abuse from managers in the last 12 months | 8.1% | 4.0% |
| Total number of responses | 1171 | 2318 |
Percentage of staff experiencing harassment, bullying or abuse from other colleagues in the last 12 months
| Disabled | Non-disabled | |
| Percentage of staff experiencing harassment, bullying or abuse from other colleagues in the last 12 months | 15.8% | 9.5% |
| Total number of responses | 1166 | 2311 |
Percentage of staff saying that the last time they experienced harassment, bullying or abuse at work, they or a colleague reported it
| Disabled | Non-disabled | |
| Percentage of staff saying that the last time they experienced harassment, bullying or abuse at work, they or a colleague reported it | 71.8% | 70.1% |
| Total number of responses | 408 | 663 |
Percentage of staff who believe that their organisation provides equal opportunities for career progression or promotion
| Disabled | Non-disabled | |
| Percentage of staff who believe that their organisation provides equal opportunities for career progression or promotion | 63.7% | 68.8% |
| Total number of responses | 1159 | 2314 |
Percentage of staff who have felt pressure from their manager to come to work, despite not feeling well enough to perform their duties
| Disabled | Non-disabled | |
| Percentage of staff who have felt pressure from their manager to come to work, despite not feeling well enough to perform their duties | 18.1% | 11% |
| Total number of responses | 746 |
964 |
Percentage of staff satisfied with the extent to which their organisation values their work
| Disabled | Non-disabled | |
| Percentage of staff satisfied with the extent to which their organisation values their work | 44.6% | 54.1% |
| Total number of responses | 1179 | 2329 |
Percentage of staff with a long-lasting health condition or illness saying their employer has made adequate adjustment(s) to enable them to carry out their work
| Disabled | |
| Percentage of staff with long-lasting health condition or illness saying their employer has made adequate adjustment(s) to enable them to carry out their work | 81.9% |
| Total number of responses | 701 |
Percentage of staff with a long-lasting health condition or illness saying their employer has made adequate adjustment(s) to enable them to carry out their work
| Disabled | Non-disabled | |
| Staff engagement score (0-10) | 7.0 | 7.3 |
| Total number of responses | 1179 | 2338 |
Appendix 2 - Equality and Diversity data as of 4 April 2024
Appendix 3 - Gender pay gap data 2022-23
| CNTW figures for 2022-2023 | CNTW figures for 2021-2022 | CNTW figures for 2020-2021 | ||||
| Male | Female | Male | Female | Male | Female | |
| Top quartile | 26.83% | 73.17% | 27.7% | 72.3% | 29.0% | 71.0% |
| Upper middle | 19.79% | 80.21% | 20.0% | 80.0% | 21.6% | 78.4% |
| Lower middle | 26.03% | 73.97% | 27.4% | 72.6% | 26.6% | 73.4% |
| Lower quartile | 20.84% | 79.16% | 19.3% | 80.7% | 20.6% | 79.4% |
| Metric | CNTW figures of 2022-2023 | CNTW figures for 2021-2022 | CNTW figures for 2020-2021 |
| Mean gender pay gap | 11.56% | 12.4% | 13.2% |
| Median gender pay gap | 0.54% | 2.2% | 3.4% |
Appendix 3 - Gender pay gap data 2022-23
| Metric | CNTW figures of 2022-23 | CNTW figures for 2021-22 | CNTW figures for 2020-21 |
| The mean gender bonus gap: the % difference in the average bonus payments made to male and female employees during the 12 month period to 31 March | 10.99% | 9.6% | 22.3% |
| The median gender bonus gap: the % difference between the mid-point value of bonus payments made to male and female employees during the 12 month period to 31 March | 39.35% | 31.3% | 55.9% |
| The proportions of relevant male and female employees who received bonus payments during the 12 month period to 31 March |
2.0% men 0.5% women |
2.0% men 0.5% women |
2.2% men 0.6% women |