
Health Inequalities Annual Report for 2024/25
Glossary of terms
This section explains some of the language and ideas we talk about in this report. It might be helpful to understand what we mean when we use these terms before reading the rest of the report.
Sex
The Equality Act 2010 is a law which protects people from unfair treatment. The law says your biological sex is either male or female, and that your sex is the one which is written on your birth certificate. The biological sex recorded on your birth certificate is usually decided by looking at your genitals when you are born. This is not the only way that biological sex can be understood and other genetic characteristics like your reproductive organs, hormones and chromosomes are also important in making sense of biological sex.
Some people, for example, people who are intersex, trans, or have differences of sexual development might feel excluded by the legal definition of biological sex.
Gender
Biological sex and gender identity are different things.
Gender identity is our internal feelings about being a man, woman, both or neither. Even though people might use the same word to describe their gender identity, we all have a unique experience of gender. Everyone is different and there are lots of different words to describe experiences of gender identity.
Gender identity can be fixed or it can change. You might identify with a gender different to the sex you were registered with when you were born. If you choose to, you can apply to change your legal gender.
Sexuality
Sexuality and sexual orientation refer to the experience of being attracted to another person. Some people feel attracted to others and this can be emotionally, physically or romantically. Some people don’t experience these attractions.
Your sexuality is not linked to your biological sex or to your gender identity. No one can know a person’s sexuality by knowing their biological sex or gender identity. Research shows that lesbian, gay, bisexual, trans and other LGBTQ+ people experience unfair differences in health compared to heterosexual (straight) and cisgender people (whose gender identity is the same as the sex recorded on their birth certificate).
You can find out more about language used to describe sex, gender and sexuality from the charity Stonewall: List of LGBTQ+ terms (stonewall.org.uk)
Ethnicity
Ethnicity describes the population group a person belongs to or identifies with. What people consider part of their ethnic identity can be different for different people, and can include things like ancestry, culture, identity, religion, language, and physical appearance.
The Equality Act 2010 is a law which protects people from unfair treatment. The law says ethnicity includes skin colour, nationality and ethnic or national origins, and protects people from unfair treatment because of these characteristics.
Ethnicity categories
The Office for National Statistics is an organisation which produces information about the UK population and society. The Office for National Statistics uses five main ethnicity categories to produce information about people living in the UK. These categories are Asian, Black, Mixed, Other and White. We have used the same categories when talking about ethnicity in this report.
Each of these five ethnicity categories contains smaller categories which describe people’s ethnicity in more detail:
- Asian – this includes Asian or Asian British, Pakistani, Indian, Bangladeshi or Other Asian background.
- Black – this includes Black or Black British, African, Caribbean, and Other Black background.
- Mixed – this includes White and Asian, White and Black African, White and Black Caribbean, and Other Mixed background.
- Other – this includes Chinese, Arab, and other ethnic groups.
- White – this includes White British, Irish, and Other White backgrounds including Gypsy and Roma.
Patient and Carer Race Equality Framework (PCREF)
NHS England is the organisation which runs the NHS in England. NHS England has asked all NHS services which use taxpayers’ money to provide mental health support to develop a plan to stop unfair treatment of people from minority ethnic and cultural groups. NHS organisations need to work together with local communities who experience unfair treatment to develop the plan, which will be called the Patient and Carer Race Equality Framework (PCREF).
Find out more about the Patient and Carer Race Equality Framework
Racialised and culturally minoritised backgrounds
Some people feel like the language used in laws and government documents doesn’t reflect their cultural identity and experience.
The Patient and Carer Race Equality Framework uses the term ‘racialised and culturally minoritised communities’ to describe people from minority ethnic and cultural backgrounds, and people who do not speak English as a first language.
We use the term racialised and culturally minoritised in this report. It refers to:
- Ethnic, racial and cultural communities who are minoritised populations in England, who have been racialised, and who experience marginalisation. When we say a community has been racialised, it means people have put members of that community into a category based on what they look like and made judgments about them which are not based on fact.
- People with different cultural or ethnic identities, which can include people who speak different languages and who have different cultural traditions and spiritual or religious beliefs.
- White minorities including Gypsy, Roma and Irish Traveller groups and Jewish people.
Index of Multiple Deprivation
In England we use a system called the Index of Multiple Deprivation to understand the level of resources and services people have available to them, and whether they live in safe and healthy environments.
This system combines information about living environments, income, employment, education, health, crime, and how difficult it is to access housing and services for every postcode area in England. Each postcode is given a score, which helps us to understand which postcode areas have the worst access to resources, services and safe and healthy environments (most deprived) and which have the best (least deprived).
The Index of Multiple Deprivation system splits all English postcode areas into five groups based on their score. Each of the five groups of postcodes represents 20% of the population in England, from the most deprived to the least deprived. The five groups of postcodes are called ‘quintiles’. Knowing which of the five groups or ‘quintiles’ a postcode belongs to helps us to understand the access to resources, services and safe and healthy environments people living in that postcode have in comparison to people living in other areas in England.
CNTW area
In this report, when we use the term ‘CNTW area’, we mean the group of areas where our Trust provides services: Northumberland, Newcastle, North Tyneside, North Cumbria, Gateshead, Sunderland, and South Tyneside.
Census 2021
The Census is a national survey which is carried out by the Office for National Statistics every 10 years. The Census asks questions about the person filling out the survey, the people they live with and where they live. Information from the Census helps the government and local authorities plan and fund local services including schools and education, doctors’ surgeries and roads.
The last Census was carried out in 2021. We have used information from the 2021 Census in this report.
About Cumbria, Northumberland, Tyne and Wear NHS Foundation Trust (CNTW)
Cumbria, Northumberland, Tyne and Wear NHS Foundation Trust (also known as CNTW) is an organisation which is part of the NHS. We provide support to people living in North Cumbria, Northumberland, Newcastle, North Tyneside, Gateshead, South Tyneside and Sunderland.
We are a specialist mental health and learning disabilities organisation, and we provide support to people of all ages with a wide range of different needs.
We employ around 9,000 people and spend more than £500 million a year to deliver our services. We support people in their own homes, their local communities and in our hospitals.
This report is about unfair differences in our services. To help us make sure we achieve our goal of reducing unfair differences in our services, senior members of staff lead focused pieces of work to tackle different aspects of health inequalities. This report does not describe all the work our organisation is doing to tackle health inequalities. Only the projects linked to the themes in this report are included. The most senior leaders in our organisation, our Trust Board, will make sure we work to address unfair differences in our services in partnership with our communities, patients and carers.
You can find out more on the CNTW website (the site you are on now).
Our Vision
At Cumbria, Northumberland, Tyne and Wear NHS Foundation Trust (CNTW) we want to work together with compassion and care, to keep you well over the whole of your life. One of the things we need to do as a Trust to achieve our aim is to better understand and address health inequalities.
What are health inequalities?
Health inequalities are differences in access to health services, health outcomes and experiences of care between different groups in society. These differences are unfair and avoidable.
- People who are poorer, live in less safe and less healthy environments, and who find it difficult to use health services tend to live shorter lives. People living in the North East and North Cumbria tend to die younger than people living in some other parts of England.
- During the pandemic, people living in the UK who aren’t White were more likely to die from Covid-19 than White people. People from Pakistani and Bangladeshi backgrounds had the highest chance of dying from Covid-19.
These are examples of health inequalities – unequal and unfair differences in health between different groups of people.
Using data to understand health inequalities
Understanding exactly what causes health inequalities can be difficult, as there is often more than one cause. We use the term ‘data’ to describe the information we collect about our services and the people that use them. In the NHS we collect a lot of data, and we can use this to try to understand what might be causing unfair differences in health.
While data can be a helpful starting point for understanding inequalities, it doesn’t tell us everything we need to know about what causes unfair differences in health. We need to work together with local communities to really understand how these unfair differences impact you, your health and how you experience or feel about getting support from CNTW. We also need to listen to feedback from our communities about what needs to change to make sure our services are welcoming to people from all backgrounds and able to meet their needs.
If you would like to know more about the data we collect and some of the gaps in the data which it might be helpful to understand before reading the rest of this report, you can read our 2023/24 PCREF report.
About this report
This report provides a summary of data about some of the services CNTW provides:
- Talking Therapies
- Children and young people’s access to mental health services
It also includes a summary of data about what can happen to people when they need to be cared for in one of our hospitals:
- Being kept in hospital under the Mental Health Act
- Restrictive interventions
These services and types of care are explained in more detail in the different sections of this report.
In this report we talk about any unfair differences in health linked to people’s age, ethnicity, biological sex and deprivation – whether people have access to safe and healthy environments and the resources and services they need to stay well. In the next section of this report, we explain what we mean when we use these terms. We have included a more detailed explanation in the Glossary section at the beginning of this report.
The data included in this report was collected between April 2024 and March 2025.
The information in this report comes from historical data stored in our electronic patient records and from official statistics and should be considered experimental. The data in this report might be different from official statistics published by NHS England or by CNTW. The data in this report might be incomplete if CNTW does not have information about a patient’s sex, age, ethnicity or level of deprivation.
Key messages in this report
Health inequalities
- Health inequalities are differences in access to health services, health outcomes and experiences of care between different groups in society. These differences are unfair and avoidable.
Using data to understand health inequalities
- While data can be a helpful starting point for understanding inequalities, it doesn’t tell us everything we need to know about what causes unfair differences in health. We need to listen to feedback from our communities about what needs to change to make sure our services are welcoming to people from all backgrounds and able to meet their needs.
Detentions under the Mental Health Act
- In the CNTW area, 86 people per 100,000 population were detained under the Mental Health Act between April 2024 and March 2025. This overall detention rate is lower than the previous year, when 91 people per 100,000 population were detained under the Mental Health Act.
- The rate of detentions is higher among younger people (18-45), and among people aged 76 and over.
- The detention rate for males was higher than for females in 2024/25. While the detention rate for males in CNTW in 2024/25 is similar to last year, the detention rate for females has reduced.
- The rate of Mental Health Act detentions is highest in more deprived areas.
- Compared to the previous year, detention rates for people from the most deprived areas have reduced and there has been a small increase in the detention rates for people from less deprived areas.
Restrictive Interventions
- On average, between April 2024 and March 2025 CNTW patients experienced restrictive interventions 48 times for every 1,000 days spent in hospital.
- The overall rate of restrictive interventions has increased from the previous year; in 2023/24 patients experienced restrictive interventions 41 times for every 1,000 days spent in hospital.
- The rate of restrictive interventions is higher in the younger age groups and is highest among people aged 17 and under.
- The rate of restrictive interventions is higher among female patients.
- The rate of restrictive interventions is highest for patients with a Mixed ethnicity. Compared to the previous year, there are some significant changes in the rate of restrictive interventions for patients from different ethnic groups.
Talking Therapies recovery
- The overall Talking Therapies recovery rate for our Trust is 53%.
- Since 2023/24 we have seen the biggest increase in recovery rates among the youngest age groups (under 26) and oldest age groups (over 76).
- Talking Therapies recovery rates are similar for male and female patients.
- In 2024/25 Asian patients had the highest Talking Therapies recovery rate at 63%, and patients with an ethnicity categorised as Other had the lowest recovery rate at 32%.
- People living in more deprived areas have lower Talking Therapies recovery rates. This is the same as the previous year, although there have been small increases in Talking Therapies recovery rates in the most deprived groups.
Access to Children and Young People’s Services
- The rate of children and young people receiving at least one contact with CNTW services is higher among older children. Compared to the previous year, the rate of children and young people aged 6 to 13 receiving at least one contact with CNTW services increased in 2024/25.
- The rate of children and young people receiving at least one contact with CNTW services is higher for males than for females.
- Most of the children and young people who received at least one contact from CNTW mental health services between April 2024 and March 2025 were White (92%).
- The rate of children and young people receiving at least one contact with CNTW mental health services is highest in the most deprived areas.
Detentions under the Mental Health Act
The Mental Health Act is a law which says when you can be taken to hospital, kept there, and treated against your wishes. This should only happen if you are experiencing mental health issues which put you or someone else at risk and there are no other options which would keep everyone safe.
Being kept in hospital or ‘detained’ under the Mental Health Act is sometimes called being ‘sectioned’, because the law has different sections. Some sections of the Mental Health Act are used to treat people with mental illness who are in contact with the criminal justice system. For example, if you are on remand in prison and you experience serious mental illness, you can be transferred to a mental health hospital. The data presented in this report covers detentions under all sections of the Mental Health Act.
This year we will deliver projects which aim to reduce the number of people from marginalised ethnic backgrounds who are admitted to our hospitals under the Mental Health Act. We will do this in partnership with local community groups and patients and carers from marginalised ethnic, cultural and faith backgrounds as part of our work to improve our services for these groups (our Patient and Carer Race Equality Framework). We will use the learning from these projects in the future to tackle other unfair differences in the use of Mental Health Act detentions.
Number of detentions
- 1,522 people were detained under the Mental Health Act in the CNTW area between April 2024 and March 2025. In 2024/25 there were 87 fewer detentions than in the previous year.
- 150 people were detained under the Mental Health Act in CNTW who are registered with a GP outside the CNTW area. This might happen because:
- The person being detained is cared for by a CNTW service which accepts patients from the whole of the North East or the whole of England.
- There are no mental health hospital beds available close to where a person lives, and they are brought to a CNTW hospital instead.
- Someone is away from home or doesn’t have a stable home and are in the CNTW area when they need to be detained under the Mental Health Act.
Rate of detentions per 100,000 population
We use a rate per 100,000 population to understand differences in the use of Mental Health Act detentions between different groups.
When we use ‘rate of detentions per 100,000 population’, we are describing how many times the Mental Health Act is used to take someone to hospital, keep them there, and treat them against their wishes for every 100,000 people.
Using a rate of detentions per 100,000 population instead of the number of detentions helps us understand whether there are unfair differences in the use of the Mental Health Act between different groups in society, even when one group might contain a lot more people than another group resulting in big differences in the actual number of detentions.
- In the CNTW area, 86 people per 100,000 population were detained under the Mental Health Act between April 2024 and March 2025.
- This overall detention rate is lower than the previous year, when 91 people per 100,000 population were detained under the Mental Health Act.
Age
The chart below shows how the number of detentions per 100,000 population varies with age.
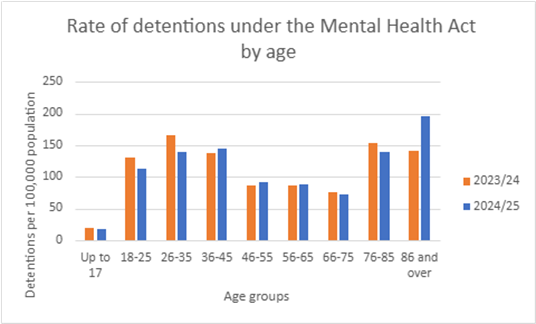
The rate is higher among younger people (18-45), and among people aged 76 and over. While this pattern in detention rates is similar to the previous year, rates have decreased in the under 36 age groups and increased in the 86 and over age group. In 2024/25 the 86 and over age group had the highest rate of detention under the Mental Health Act; in the previous year the 26-35 age group had the highest rate of detention.
Evidence shows that people are more likely to first experience psychosis (seeing and hearing things other people don’t) in their late teens and early 20s. A person might need to be detained under the Mental Health Act if their symptoms of psychosis put them or someone else at risk of harm.
There is also evidence that more people with dementia and elderly people with mental health challenges are being detained under the Mental Health Act. Our Trust cares for a lot of patients with dementia. This could explain why we see higher rates of detention among older people.
Sex
There are some differences between the detention rates for males and females:
- 101 detentions per 100,000 males
- 86 detentions per 100,000 females
The detention rate for males was higher than for females in CNTW in both 2024/25 and in the previous year. National Mental Health Act data also shows a higher detention rate for males in England overall over several years. While the detention rate for males in CNTW in 2024/25 is similar to last year, the detention rate for females has reduced.
We have more beds for male patients than for female patients. This means we are able to provide care to more males than females detained under the Mental Health Act in our hospitals. This may explain, at least partly, why the detention rate is higher for males in our Trust. We also need to consider whether the difference in detention rates could be linked to different levels of access to social support networks and community mental health support.
Deprivation
The chart below shows the rate of Mental Health Act detentions in our communities grouped by level of deprivation. The rate of Mental Health Act detentions is highest in more deprived areas. This is also the case in England as a whole.
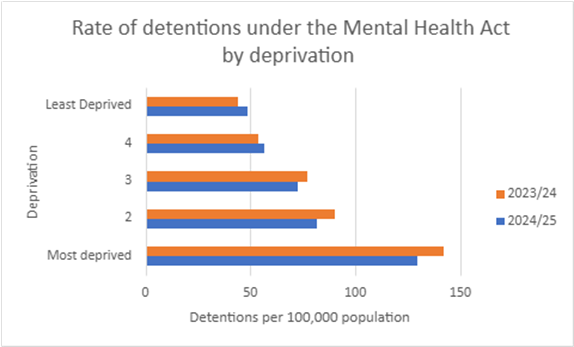
Compared to the previous year, detention rates for people from the most deprived areas have reduced and there has been a small increase in the detention rates for people from less deprived areas.
Ethnicity
The table below shows the number of times people from each ethnic group were admitted to one of our hospitals under the Mental Health Act in 2024-25:
| Ethnicity | Asian | Black | Mixed | Other | White |
| Admissions under the Mental Health Act | 62 | 53 | 20 | 24 | 1,443 |
We have again decided not to include a rate of Mental Health Act detentions among people from different ethnic groups in this year’s report.
This is because we are not confident we have accurate information about the size of different ethnic groups in our Trust area. To understand whether there are unfair differences in the use of the Mental Health Act between different ethnic groups, we need to calculate a detention rate for each group. We can’t do this using the data we record about the number of detentions, because one ethnic group might contain a lot more people than another group resulting in big differences in the actual number of detentions. We need to know the size of each ethnic group to be able to calculate the detention rate for each group correctly, and to compare the rates for different groups to understand whether people from different ethnic groups are more likely to be detained under the Mental Health Act.
Usually, detention rates for each ethnic group are calculated using information about people’s ethnicity from the 2021 Census. When we compared the 2021 Census data with other information about people’s nationality and ethnicity, including the number of adults with different nationalities registering for National Insurance numbers in the CNTW area and the number of children from different ethnic backgrounds in our local schools, there were some big differences. Community leaders representing people from minoritised backgrounds in our Trust area also told us that their communities have grown a lot in the past few years. We think that detention rates calculated using information about people’s ethnicity from the 2021 Census are likely to be inaccurate, which is why we have decided not to include detention rates for different ethnic groups in this report.
Use of restrictive interventions
Restrictive interventions are actions that limit someone’s movement or freedom. These actions are used to reduce the risk of danger to a person or the people around them. They include:
- Seclusion – patients are kept in an area away from other patients. They are not able to leave that area and are supervised by hospital staff.
- Long-term segregation – where patients are not allowed to mix freely with other patients on the hospital ward, and this rule is applied long-term.
- Manual restraint – physically holding a person’s body to limit their movement.
- Mechanical restraint – using handcuffs or other equipment to limit someone’s movement.
- Chemical restraint – using medication which is not prescribed as part of the patient’s usual care. This might include rapid tranquillisation.
- Blanket restrictions – rules applied to all patients on the ward which restrict their movement or freedom, for example, searching all patients when they come back to the ward if there’s evidence illegal drugs have been brought in to the unit.
Mental health hospitals provide care to people who are very unwell and who are experiencing severe symptoms which mean they can’t be safely cared for in the community where they live. In hospital, situations can develop which put patients and staff at risk of harm, and hospital staff must take action to reduce the risk and keep everyone safe. Sometimes restrictive interventions are necessary to reduce the risk of harm. They should only be used when a situation can’t be made safe without limiting someone’s movement or freedom.
In general, many of the actions our staff take which limit the freedom or movement of our patients involve directing the behaviours and decision-making of our patients in a supportive way. Our staff also provide personal care (things like getting ready, getting washed, and going to the toilet) to patients when they need it. Because our staff are aware of the need to keep a record of care which limits a patient’s freedom or movement, our data on restrictive interventions is likely to include these types of care as well as more restrictive types of care like the use of seclusion or rapid tranquillisation.
NHS Trusts including CNTW are working to reduce the use of restrictive interventions in the care we provide. We have improved our understanding of why, when and how restrictive interventions are used, and this will support our work to tackle unfair differences in the use of restrictive interventions in 2025/26. Over the coming year, we will be focusing on ethnicity in the work we do across our Trust to reduce the use of restrictive interventions in the care we provide. This work is a key objective of our plan to tackle inequalities in our services linked to ethnicity, faith and culture (our Patient and Carer Race Equality Framework).
Rate of restrictive interventions per 1,000 days spent in hospital
We use ‘rate of restrictive interventions per 1,000 days spent in hospital’ to understand differences between different groups in the use of care which restricts people’s movement or freedoms.
When we use ‘rate of restrictive interventions per 1,000 days spent in hospital’, we are describing how many times someone has their movement or freedom limited for every 1,000 days people from that group spend in hospital.
Using the rate of restrictive interventions per 1,000 days spent in hospital instead of the number of restrictive interventions helps us understand whether there are unfair differences in the use of this type of care between different groups in society.
Not all patients have their freedom or movement limited when they are in hospital. Depending on the situation, some individual patients might need more restrictive interventions than others to keep everyone safe. These differences in the number of restrictions between individual patients can have a big impact on the rate of interventions for particular groups of patients and CNTW patients overall.
- CNTW used care which limited the movement or freedom of our patients 10,473 times between April 2024 and March 2025.
- During the same time period, our patients spent a total of 219,819 days in hospital.
- On average, CNTW patients experienced restrictive interventions 48 times for every 1,000 days spent in hospital.
The overall rate of restrictive interventions has increased from the previous year; in 2023/24 patients experienced restrictive interventions 41 times for every 1,000 days spent in hospital.
Age
The chart below shows the rate of restrictive interventions per 1,000 days spent in hospital for people from different age groups. The rate of restrictive interventions is higher in the younger age groups.
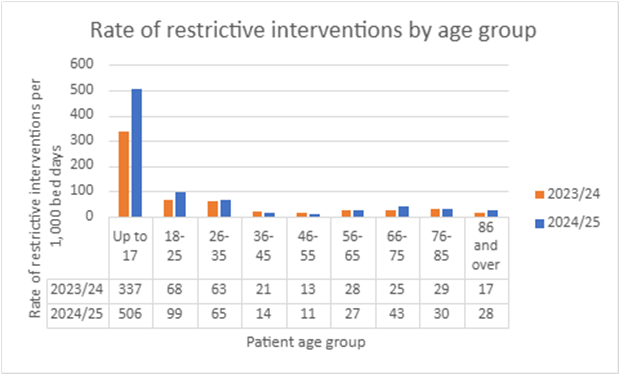
The rate of restrictive interventions is highest among people aged 17 and under at 506 restrictive interventions per 1,000 days spent in hospital. This is a big increase from the previous year when the rate of restrictive interventions for the 17 and under age group was 337 restrictive interventions per 1,000 days spent in hospital. Compared to the previous year, in 2024-25 the rate of restrictive interventions also increased quite significantly in the 18-25, 66-75, and 86 and over age groups.
Senior members of staff from our Trust are leading a review of the care we provide to children and young people to better understand how, when and why we limit the freedom or movement of young people in our care and what we can do to reduce it.
Sex
There is quite a big difference between males and females in the use of care which limits people’s movements or freedom:
- 58 restrictive interventions per 1,000 days spent in hospital for females.
- 41 restrictive interventions per 1,000 days spent in hospital for males.
We think this could be because female patients are more likely to try to hurt themselves while they are in hospital. In these situations, it is very risky not to take action to keep the patient safe.
Ethnicity
There are differences between ethnic groups in the use of care which limits people’s movement or freedom. The chart below shows the rate of restrictive interventions for each of the five main ethnic groups in 2024/25.
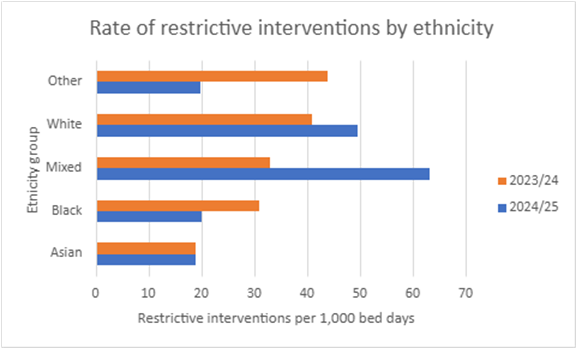
When we compare these rates to the previous year, we see some big differences:
- The rate of restrictive interventions for Asian patients was the same in both 2023/24 and 2024/25, at 19 restrictive interventions per 1,000 days spent in hospital.
- There was a large decrease in the rate of restrictive interventions for Black patients, from 31 restrictive interventions per 1,000 days spent in hospital during 2023/24 to 20 restrictive interventions per 1,000 days spent in hospital in 2024/25.
- The rate of restrictive interventions for patients with a Mixed ethnicity almost doubled, from 33 restrictive interventions per 1,000 days spent in hospital during 2023/24 to 63 restrictive interventions per 1,000 days spent in hospital in 2024/25.
- The rate of restrictive interventions for White patients increased from 41 restrictive interventions per 1,000 days spent in hospital during 2023/24 to 50 restrictive interventions per 1,000 days spent in hospital in 2024/25.
- The rate of restrictive interventions for patients with an ethnicity in the Other category reduced by more than 50%, from 44 restrictive interventions per 1,000 days spent in hospital during 2023/24 to 20 restrictive interventions per 1,000 days spent in hospital in 2024/25.
The number of restrictive interventions received by individual patients can have a big impact on the rate of interventions for particular groups of patients. If a small number of patients from one ethnic group have a high number of restrictive interventions, this can result in a big increase in the rate of restrictive interventions for that particular ethnic group in that year. This may, at least in part, explain why we see big differences in the rate of restrictive interventions from year to year.
Deprivation
The chart below shows the rates of restrictive interventions per 1,000 days spent in hospital for people with different levels of access to resources, services, and safe and healthy communities.
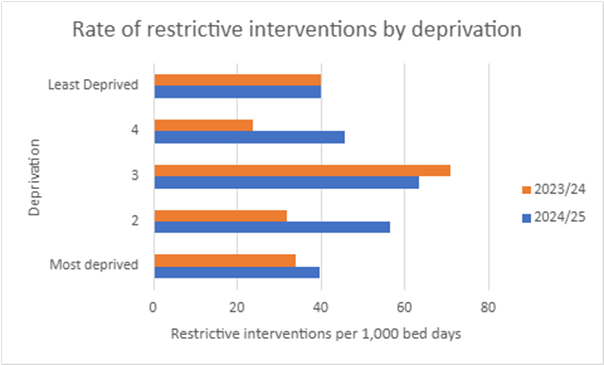
The rate of restrictive interventions per 1,000 days spent in hospital is highest for people in the third segment or ‘quintile’ who don’t live in our most deprived or most privileged communities. This was also the case in the previous year, although the rate of restrictive interventions for this group has reduced from 71 restrictive interventions per 1,000 days spent in hospital during 2023/24 to 63 restrictive interventions per 1,000 days spent in hospital in 2024/25.
The rate of restrictive interventions per 1,000 days spent in hospital has increased since the previous year for people living in the most deprived areas. There was a large increase in the rate of restrictive interventions for people in the second most deprived area (quintile 2), from 32 restrictive interventions per 1,000 days spent in hospital during 2023/24 to 56 restrictive interventions per 1,000 days spent in hospital in 2024/25. The rate of restrictive interventions increased by almost 50% for people from the second least deprived area (quintile 4), from 24 restrictive interventions per 1,000 days spent in hospital during 2023/24 to 46 restrictive interventions per 1,000 days spent in hospital in 2024/25.
Talking Therapies recovery
NHS Talking Therapies is a service which provides support for people with anxiety disorders and depression. In Talking Therapies, people work with their therapist to understand their problems, overcome their challenges, and achieve their goals. As the name suggests, Talking Therapies involves talking with a therapist, as well as doing practical exercises.
CNTW provides Talking Therapies in Sunderland and North Cumbria. Talking Therapies is available across the CNTW area, but in Newcastle, Gateshead, South Tyneside, North Tyneside and Northumberland, the Talking Therapies service is not provided by CNTW.
When people are referred to Talking Therapies they are assessed to see whether their symptoms of anxiety or depression are severe enough that they could meet the criteria to be clinically diagnosed with a mental health condition. A person is considered to have recovered following their Talking Therapies treatment if they met the clinical diagnosis criteria when they were referred to the service, but their symptoms were not considered severe enough to meet the clinical diagnosis criteria at the end of their treatment.
A lot of people who aren’t considered ‘recovered’ based on this definition still feel like their mental health has improved after getting support from Talking Therapies. The term ‘Talking Therapies recovery’ does not mean patients no longer experience challenges with their mental health. Recovery from mental health challenges can be a long and difficult journey and Talking Therapies can provide support to help patients manage their symptoms.
We use the term ‘Talking Therapies recovery rate’ to understand differences in Talking Therapies recovery between different groups. When we use ‘Talking Therapies recovery rate’, we mean the percentage of all the people from that group who did not have symptoms of anxiety disorder and depression severe enough to meet the criteria for a clinical diagnosis of mental illness at the time they finished receiving support from Talking Therapies.
5,603 patients in Sunderland and North Cumbria completed Talking Therapies between April 2024 and March 2025. 53% of these patients were considered to have recovered, based on the definition of Talking Therapies recovery described in the paragraph above. The information in this section of the report is about these patients.
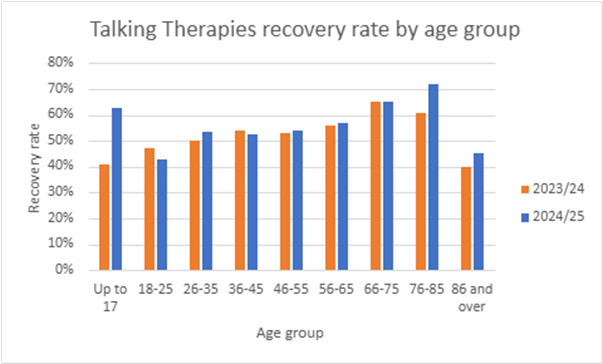
Age
The chart below shows the Talking Therapies recovery rate for different age groups. Since 2023/24 we have seen the biggest increase in recovery rates among the youngest age groups (under 26) and oldest age groups (over 76). At 53%, the overall Talking Therapies recovery rate is similar to the previous year, when it was 52%.
Sex
Talking Therapies recovery rates are very similar for male and female patients:
- 3% recovery for male patients (including trans men)
- 8% recovery for female patients (including trans women)
The recovery rate for male patients has increased compared to the previous year when it was 51%. The recovery rate for female patients has decreased slightly compared to the previous year when it was 53%.
Because we use a different computer system to record information about patients who access our Talking Therapies service, we are able to collect data about Talking Therapies recovery for patients who identify as trans man, trans woman and non-binary (people who don’t identify as either a man or woman). We can’t publish information about very small numbers of patients because there is a risk the information could be used to identify individual people, and people’s healthcare information must be kept private. Because of this, we haven’t included the Talking Therapies recovery rate for people who identify as non-binary in this report. Some of our Talking Therapies staff have completed training on gender and trans issues and work closely with partners to make sure that the service meets the needs of people with different gender identities.
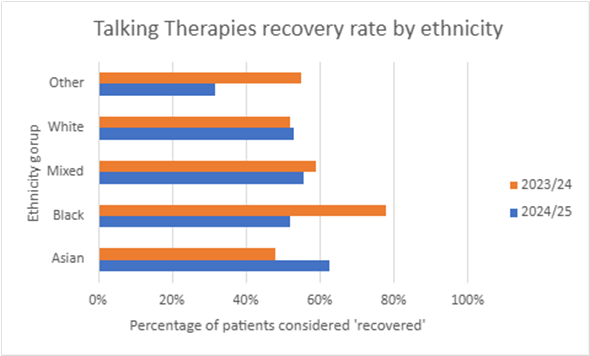
Ethnicity
The chart below shows the recovery rate for people from different ethnic groups who completed Talking Therapies treatment provided by CNTW in Sunderland and North Cumbria between April 2024 and March 2025. Compared to the previous year:
- The recovery rate for Asian patients increased from 48% to 63%.
- The recovery rate for Black patients reduced from 78% to 52%.
- The recovery rate for patients with a Mixed ethnicity reduced slightly from 59% to 56%.
- The recovery rate for White patients increased slightly from 52% to 53%.
- The recovery rate for patients with an ethnicity in the Other category reduced from 55% to 32%.
The number of patients from each ethnic group who complete Talking Therapies can have a big impact on the recovery rate. If a small number of patients from one ethnic group completes Talking Therapies each year, that could explain, at least in part, why we see big differences in the recovery rate for that ethnic group from year to year. Because a lot less people from marginalised ethnic backgrounds complete Talking Therapies than White people, we don’t have enough data to understand whether people from these communities have a better or worse experience of Talking Therapies than White people.
The NHS Race and Health Observatory is a group of experts on unfair differences in health among people from racialised and culturally minoritised backgrounds. Research from the NHS Race and Health Observatory shows that, in general, people from Black and ethnic minority communities have worse NHS Talking Therapies recovery rates than White people (NHS Race and Health Observatory, ‘Ethnic Inequalities in Improving Access to Psychological Therapies (IAPT)’, November 2023). They also have worse access to Talking Therapies services than White people. People from Pakistani, Bangladeshi, Other Asian, Mixed White, Black Caribbean and Other ethnic groups were found to have worse recovery rates than people from other minoritised groups.
The research suggests that unfair differences in Talking Therapies recovery rates are caused by:
- People from minoritised communities being more unwell when they first go to Talking Therapies.
- People from minoritised communities living in areas with higher unemployment and worse access to resources, services, and safe and healthy environments.
- People from minoritised communities waiting longer for their first Talking Therapies appointment and waiting longer between appointments.
Some of our Talking Therapies teams have completed training focused on meeting the needs of people from different cultural backgrounds. When our Talking Therapies teams assess a patient’s mental health needs, they ask questions about the patient’s ethnic and cultural background and any specific needs they might have. Our staff are also supported to develop their knowledge and ability to effectively support people from marginalised ethnic and cultural backgrounds who come to Talking Therapies.
Deprivation
The chart below shows the difference in Talking Therapies recovery rates for people with different levels of access to resources, services, and safe and healthy communities.
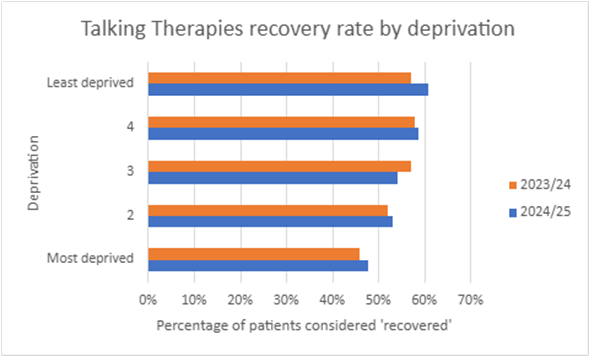
People living in more deprived areas have lower Talking Therapies recovery rates. This is the same as the previous year, although there have been small increases in Talking Therapies recovery rates in the most deprived groups. The biggest increase in recovery rates since the previous year was in the least deprived group.
Not having access to resources, services and safe and healthy environments could reduce the benefit people get from therapy and make recovery more difficult. Talking Therapies can support people to manage their mental health symptoms, but it can’t fix all of the issues which might cause those symptoms like money worries, job insecurity, or poor quality housing (Nuffield Trust, NHS Talking Therapies (IAPT) programme, updated April 2024).
Some of our Talking Therapies services have Employment Advisers who support people who are finding it difficult to find a job or keep their job when they come to Talking Therapies. Our Employment Advisers focus on helping people find a job or find a better job and stay in work. This can make a big difference in terms of helping people to improve their mental health.
Children and young people’s access to mental health services
This section of the report is about children and young people’s access to mental health services. People have different ideas about what the term access means. In this report, when we use the term access, we mean a young person aged 0 – 17 (up to and including the day before their 18th birthday) has had at least one contact with CNTW services. A contact can mean a face-to-face appointment, a video call or a phone call with CNTW services. Contact with the parent or carer of a child or young person and conversations between staff involved in caring for a child or young person are counted as contacts. Emails and texts don’t count as contacts.
Senior staff from our organisation are leading a project to better understand and tackle barriers to access to our services for children and young people from different backgrounds. The project will focus on improving access to our services for children and young people from the least advantaged backgrounds and marginalised groups. We will do this in partnership with children and young people, their families, and local community organisations which support and represent children and young people from different backgrounds.
Age
The chart below shows how many children and young people in every 1,000 had at least one contact with CNTW services between April 2024 and March 2025, broken down by age group.
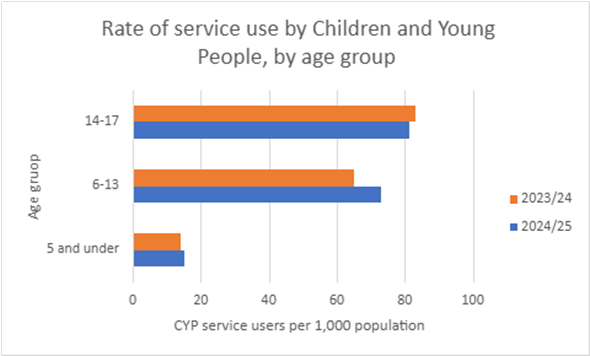
Older children and young people are more likely to receive at least one contact with CNTW services:
- 81 in every 1,000 children and young people aged between 14 and 17 had at least one contact with CNTW services between April 2024 and March 2025.
- 73 in every 1,000 children and young people aged between 6 and 13 had at least one contact with CNTW services in 2024/25. This is an increase from the previous year, when 65 in every 1,000 children aged between 6 and 13 had at least one contact with CNTW services.
- 15 in every 1,000 children aged 5 and under had at least one contact with CNTW services in 2024/25.
Half of all mental health issues begin by the age of 14, and three quarters of mental health problems begin by the age of 24 (NHS England, NHS Long Term Plan, 2019). While this might explain why we see a higher rate of contact with CNTW services among older children and young people, we need to work with our patients, communities and partners to better understand these differences and the actions we need to take to tackle any inequalities.
Sex
There is a difference between males and females in the rate of children and young people accessing our services:
- 52 in every 1,000 female children and young people in our area had at least one contact with CNTW services between April 2023 and March 2024.
- 61 in every 1,000 male children and young people in our area had at least one contact with CNTW services.
Compared to the previous year, there was an increase in access rates for both male and female children and young people, with a slightly bigger increase in the access rates for males. Research suggests that in England as a whole, similar numbers of males and females aged 8 to 16 experience mental health problems (NHS England, Mental Health of Children and Young People in England, 2023 – wave 4 follow up to the 2017 survey, November 2023).
Ethnicity
The table below shows how many children and young people receiving at least one contact from CNTW mental health services come from different ethnic backgrounds:
| Ethnicity | Asian | Black | Mixed | White | Other |
| Number of children and young people receiving at least one contact with CNTW services | 308 | 134 | 932 | 17,533 | 157 |
| % of patients | 2% | 1% | 5% | 92% | 1% |
Unfortunately, this data on its own doesn’t tell us everything we need to know to understand whether there are any unfair differences in children and young people’s access to mental health services because of ethnicity.
Data from the 2021 Census shows that in England and Wales, there are some big age differences between ethnic groups. For example, the Census showed that while 18.5% of all the people living in England and Wales were aged 0 – 15, nearly half (48.6%) of all the people in England and Wales who identified as Mixed ethnicity White and Black African were aged 0 – 15 (Office for National Statistics ‘Ethnic group by age and sex, England and Wales: Census 2021’, January 2023).
To understand whether there are unfair differences in children and young people’s access to mental health services because of ethnicity, we need to know how many children and young people aged under 18 from each ethnic group live in the CNTW area. This data would allow us to understand whether differences in the number of children and young people from each ethnic group who had at least one contact with CNTW mental health services are caused by differences in the size of each ethnic group, or are unfair and caused by inequalities which we can take action to tackle.
We think the number of children and young people from each ethnic group who live in the CNTW area could have changed quite a lot since the Census 2021 data was collected. We have developed a new approach to understanding access to our services among children and young people from marginalised ethnic backgrounds as part of our work to tackle inequalities in our services linked to ethnicity, faith and culture (our Patient and Carer Race Equality Framework). We will use this data to inform and monitor our plans for improving access to community mental health services for children and young people from marginalised ethnic backgrounds, which will be delivered in partnership with local communities.
Deprivation
The chart below shows how many children and young people in every 1,000 received at least one contact from CNTW mental health services between April 2024 and March 2025 in areas with different levels of access to resources, services, and safe and healthy environments.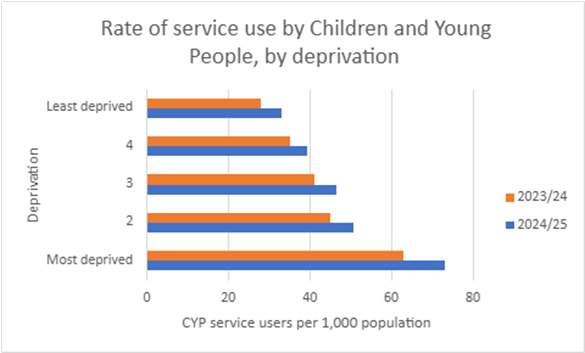
Using a rate per 1,000 population allows us to understand whether there are unfair differences in children and young people’s access to mental health services between areas, even when one area might contain a lot more people than another resulting in big differences in the actual number of children and young people accessing CNTW services.
The rate of children and young people receiving at least one contact with CNTW services is highest in the areas with the worst access to services, resources and safe and healthy environments (most deprived):
- In the areas with the worst access to services, resources and safe and healthy environments (most deprived), 73 in every 1,000 children accessed CNTW services between April 2023 and March 2024.
- In the areas with the best access to services, resources and safe and healthy environments (least deprived), 33 in every 1,000 children accessed CNTW services.
While this is a similar pattern to last year, in 2024/25 there was an increase in the rate of children and young people accessing our services across all groups from the most to least deprived. The biggest increase in access rates was among children and young people from the most deprived areas. It is possible that this is because children and young people and their families living in the most deprived areas are facing increasingly difficult circumstances which put their mental health at risk. This could lead to more children and young people from this group experiencing complex mental health challenges and needing support from our services.